You should not have to open six tabs to know how your business is doing.
Most service business owners piece together the picture of their business from email, spreadsheets, their CRM, and their memory. I build one view that tells you what is actually happening, with the metrics that matter, not a vanity wall.
The problem
Running your business from memory
Most owners I talk to cannot answer basic questions about their own business without digging. How many active deals do we have. What is our average response time on leads. Which client account is slipping. How many hours did we bill last month versus the month before.
The data exists. It is in your CRM, your accounting software, your project tool, your inbox. It is just scattered across six places, out of date in at least three of them, and nobody has the time to stitch it together every week.
So you run on gut feel and last week's guesses. You make decisions slower than you should. You find out about problems weeks after they started. You have the weekly check-in where you ask your team questions you should be able to answer without asking.
What I set up
One view of the business.
A single dashboard that pulls from your actual systems. Revenue, pipeline, team capacity, delivery status, cash position. The numbers that would change what you do next week if you knew them.
Live, not weekly.
Not a spreadsheet someone updates Friday afternoons. The dashboard reads from your CRM, your accounting, your project tool, directly. What you see is what is actually happening right now.
Alerts when something is off.
Pipeline dropped below a threshold? You get a notification. Delivery slipping on a client account? Notification. Cash runway shortening? Notification. You stop finding out about problems two weeks after they started mattering.
Weekly digest, in plain English.
Every Monday morning, a one-page email with the story of the previous week. Not a wall of charts. What went up, what went down, what needs your attention, what does not.
Team access to the numbers that affect them.
Your account lead sees their accounts. Your sales person sees their pipeline. Your ops lead sees team capacity. Everyone works from the same numbers. The weekly meeting stops being a status update and starts being a decision meeting.
What this looks like
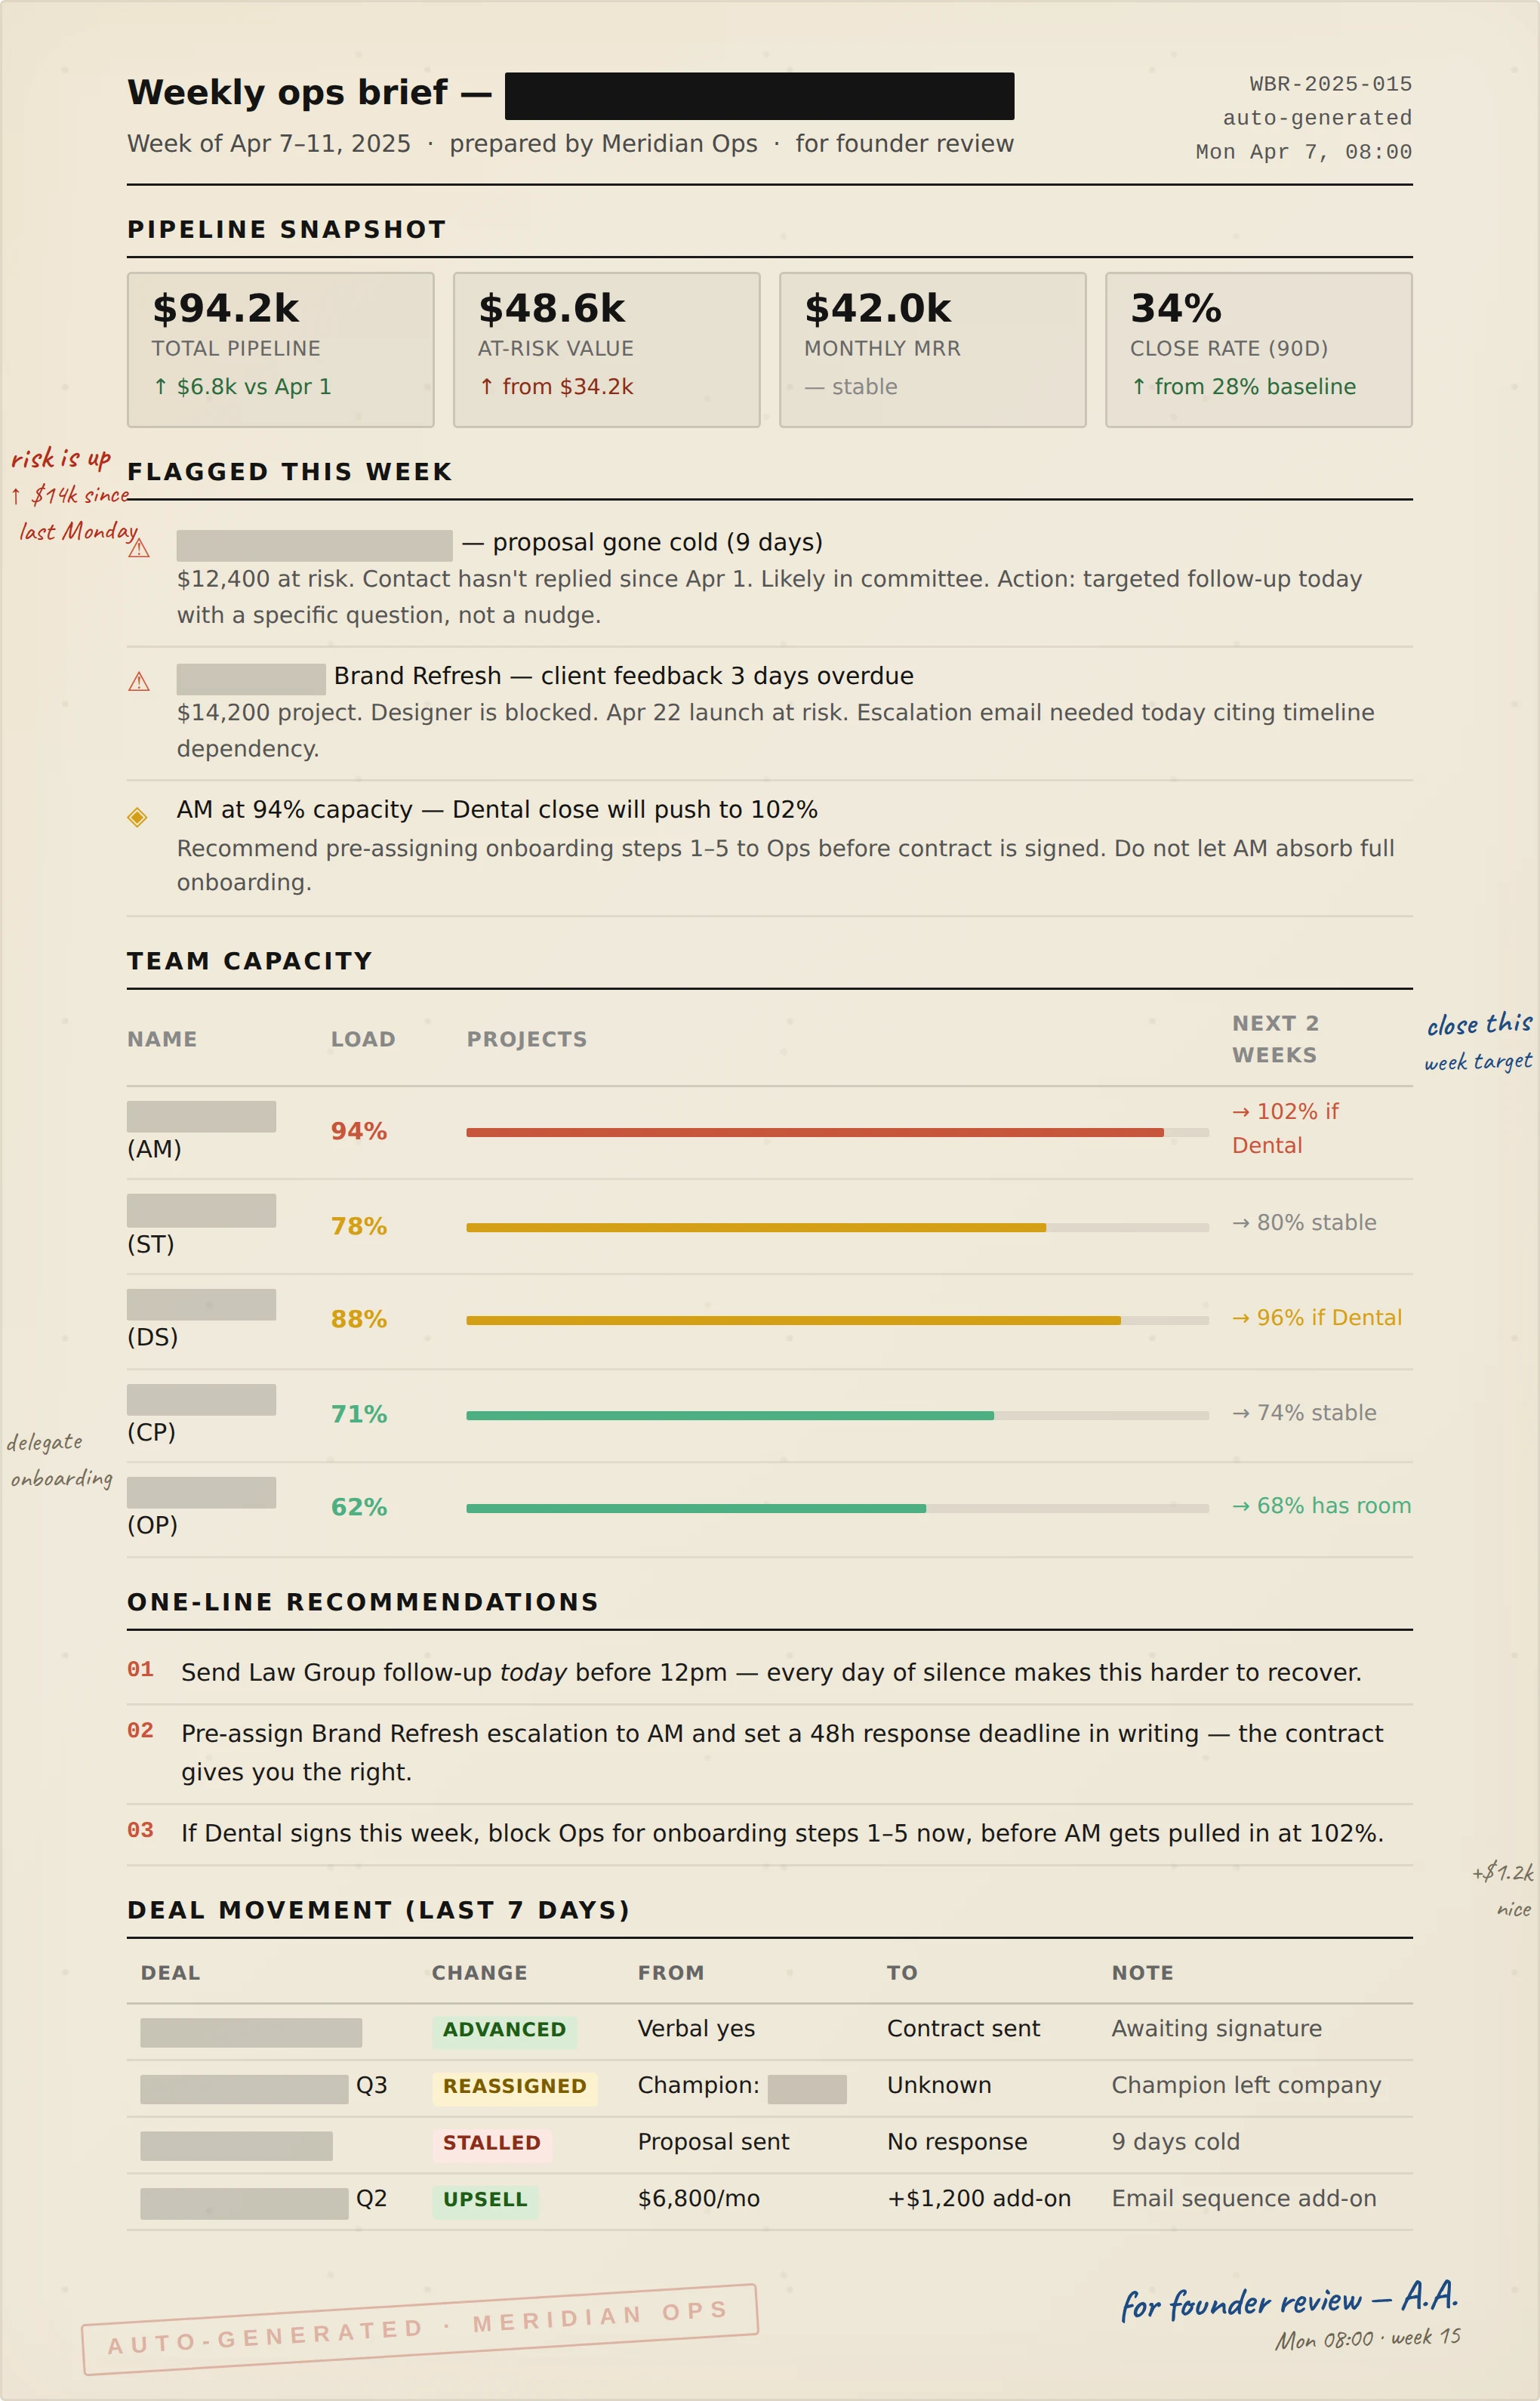
This is the document a founder opens on Monday morning. Pipeline, risks, team capacity, and three recommendations — all on one page, assembled automatically. No logging in, no asking the team, no chasing updates. The founder sees what is moving and what needs their attention before the first meeting of the week.
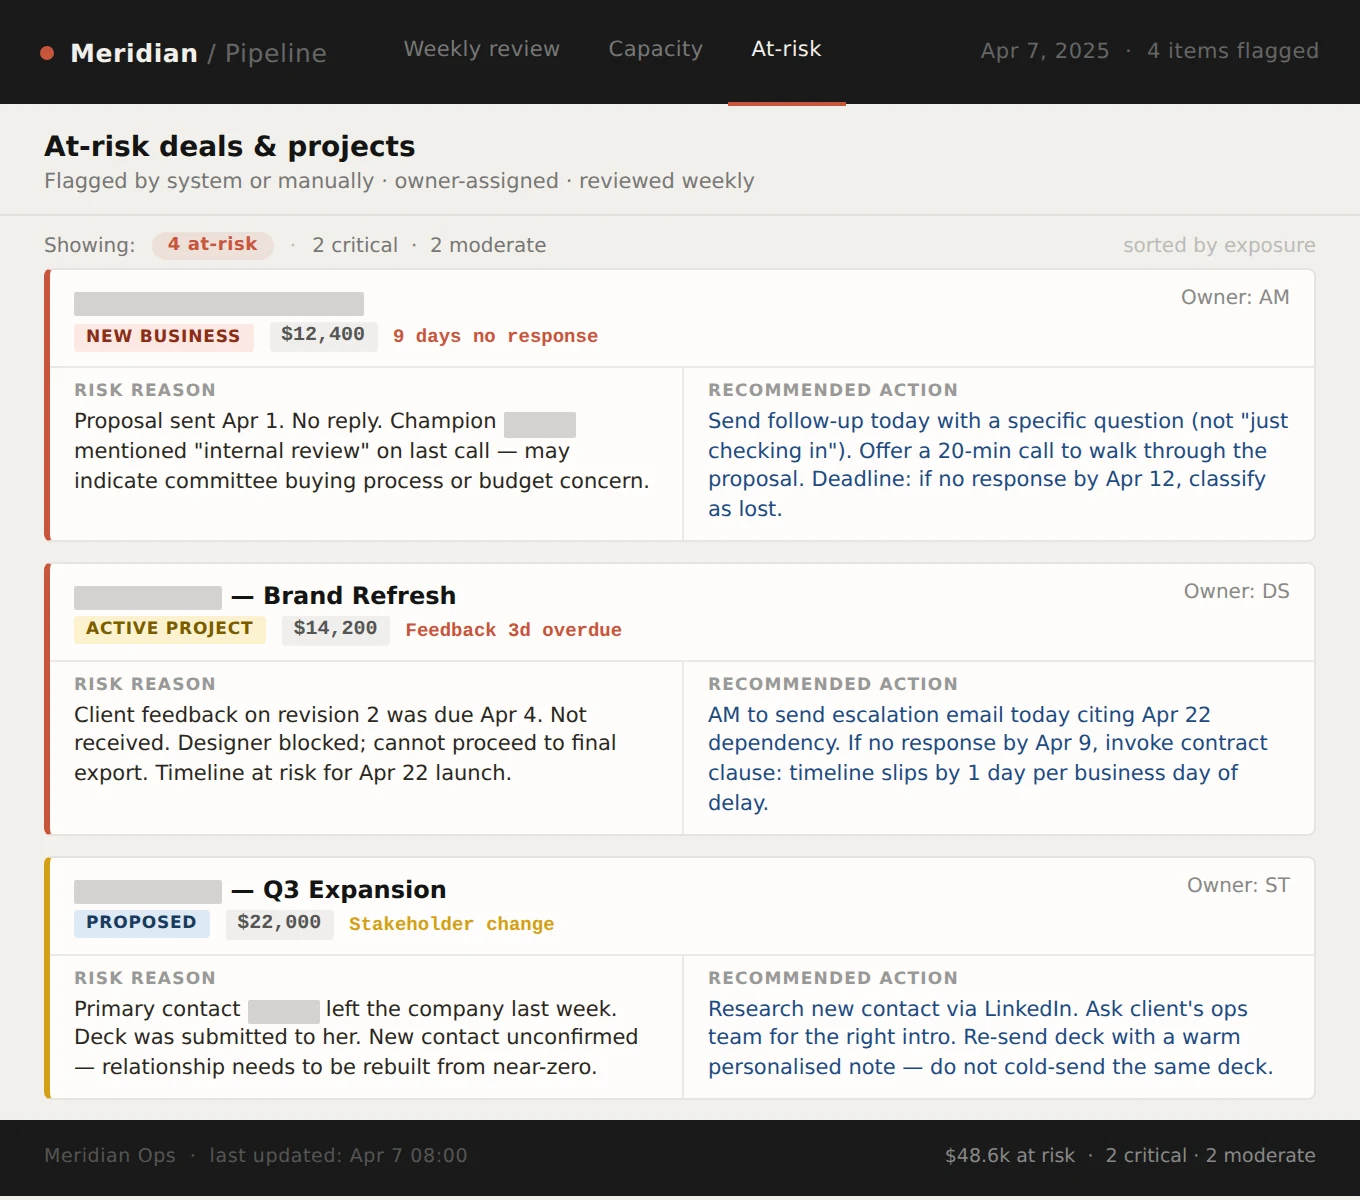
Every deal that has gone quiet, in one place. Each row has a reason and a recommended action, so the team knows exactly what to do next. No more “I thought you were handling that.”
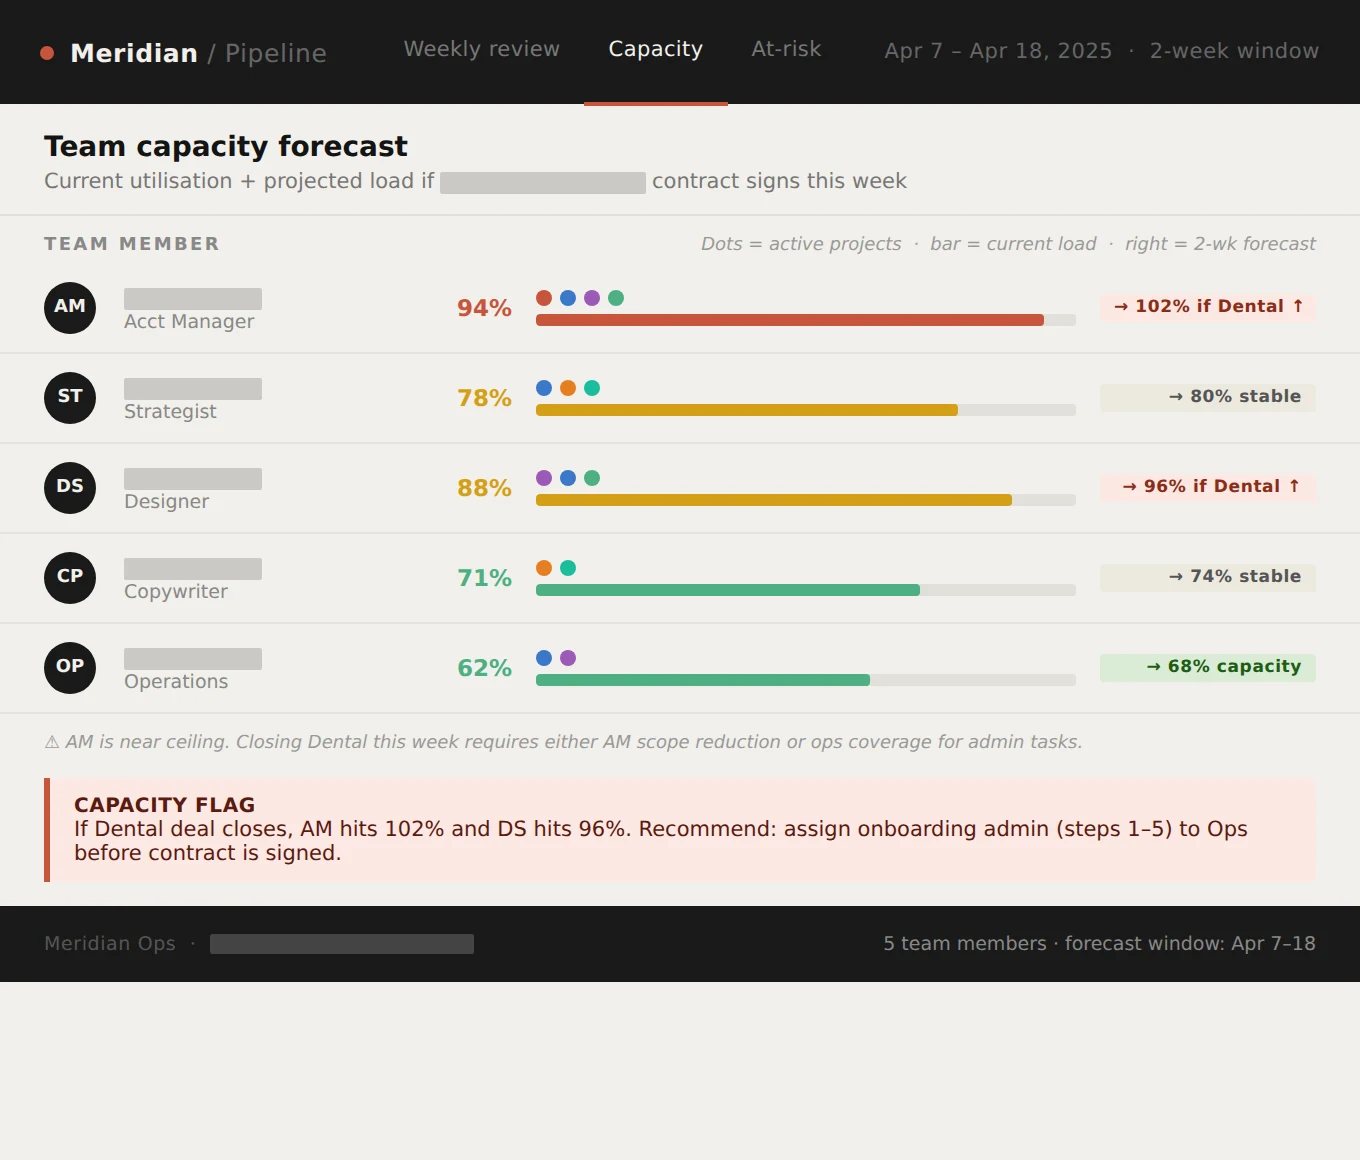
Who is about to be over capacity, and what to do about it. Forecasts forward by two weeks and flags in advance. The founder stops saying yes to work the team cannot actually deliver.
Tools I use
Lightweight, not enterprise
- Your existing CRM, accounting, and project management as data sources
- A lightweight BI layer (Metabase, Looker Studio, Power BI)
- Automation to keep the data fresh without manual entry
- Simple email or Slack notifications, not yet another app to check
Small businesses do not need Tableau or Snowflake. They need a dashboard they can actually read, that updates without anyone remembering to update it. I build for clarity, not completeness.
How it works
The decisions conversation.
Before I build anything, I ask one question: what decisions do you make every week, and what number would change what you decide? We design the dashboard around those decisions, not around "metrics that might be interesting."
Design the view.
I sketch the dashboard on paper first. One view, no tabs, no toggles. Every chart earns its place. You approve before any code is written.
Build and connect.
I wire up the data sources, build the dashboard, set the alerts, and write the weekly digest template. I test every number against a manual count to make sure it is telling the truth.
Team rollout.
Thirty-minute session with you and your team. I show you what to look at, when, and what to do when a number surprises you. After that, it runs on its own.
The math
Most owners I work with check on their business 3 to 4 times a week, each check eating 15 to 30 minutes of asking, searching, piecing together.
That is roughly 80 hours a year of founder time recovered. At your billable rate, that math alone usually pays for the engagement.
The bigger win is decisions made days or weeks earlier than they would have been. Which usually saves more than the hours ever did.
Hard to put a dollar figure on "I caught a problem before it cost me a client," but every owner I have worked with says that is the value, not the time saved.
Common questions
We have reports already. Why do we need this?
If your reports answer what you need without digging, you do not need this. Most businesses have reports that nobody reads because they take too long to understand. One view, one page, five numbers, is different from that.
Our data is messy. Can you still do this?
Yes, but we may need a week up front to clean it up. Messy data is the norm. What matters is that the handful of numbers we actually need are reliable. I do not try to fix everything, I fix the part that matters for the decisions you make.
Can my team update it themselves?
Most of the time, no updates are needed, because it reads from live systems. If you want to add a new metric later, I document how, or I come back for a small follow-up. I do not leave you dependent on me.
What if our business is too simple for a dashboard?
Then the dashboard is three numbers on one page. Simpler is better. If it turns out you do not need even that, I will tell you in the first call and not sell you the work.
Stop running your business from memory.
Book a call. Tell me what decisions you make every week. I will tell you the three numbers you should be able to see without opening anything.
Book the call